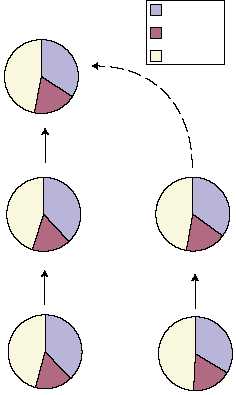
Greenbaum et al - Figure 4
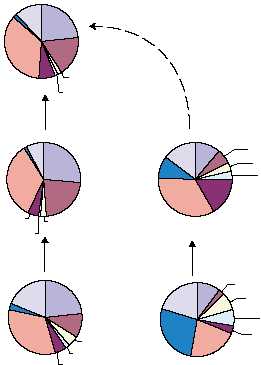
7%
11%
6%
4%
4%
17%
33%
10%
15%
26%
22%
3%
1%
5%
34%
1%8%
10%
2%
8%
3%
22%
28%
20%
23%
11%
5%
2%
5%
32%
3%
19%
23%
18%
2%
1%
7%
36%
1%
12%
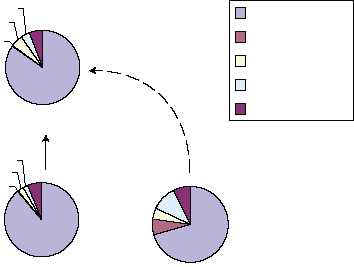
Metabolism (1)
Energy (2)
Cell growth, cell division
and DNA synthesis (3)
Transcription (4)
Protein synthesis (5)
Cellular organization (30)
Unclassified (98, 99)
Other
c
22.7%
15.2%
12.0%
32.3%
17.8%
70.7%
6.6%
4.7%
10.8%7.2%
65.5%
2.7%
11.5%
6.2%
14.2%
88.8%
0.3%
2.6%
2.1%
6.2%
84.8%
0.3%
5.3%
4.0%
5.7%
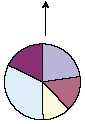
b
Function
Cytoplasm
Membrane
Mitochondria
Nucleus
Other
Localization
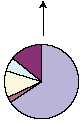
Secondary structure
a
16.4%
45.8%
37.8%
38.2%
16.8%
45.0%
34.1%
19.1%
46.9%
35.0%
17.9%
47.2%
33.5%
17.4%
49.0%
a
-helix
b
-sheet
Coil