The Morph Server: A standardized system for analyzing and visualizing macromolecular motions in a database framework
Werner G. Krebs and Mark Gerstein
Department of Molecular
Biophysics and Biochemistry
Yale University
PO Box 208114
New Haven, CT 06520, USA;
e-mail: Mark.Gerstein@yale.edu
Version 1000105
Abstract
The number of solved structures of macromolecules that have the same fold and thus exhibit some degree of conformational variability is rapidly increasing. It is consequently advantageous to develop a standardized terminology for describing this variability and automated systems for processing protein structures in different conformations. We have developed such a system as a “front-end” server to our database of macromolecular motions. Our system attempts to describe a protein motion as a rigid-body rotation of a small “core” relative to a larger one, using a set of hinges. The motion is placed in a standardized coordinate system so that all statistics between any two motions are directly comparable. We find that while this model can accommodate most protein motions, it cannot accommodate all; the degree to which a motion can be accommodated provides an aid in classifying it. Furthermore, we perform an adiabatic mapping (a restrained interpolation) between every two conformations. This gives some indication of the extent of the energetic barriers that need to be surmounted in the motion, and as a by-product results in a “morph movie.” We make these movies available over the web to aid in visualization. Many instances of conformational variability occur between proteins with somewhat different sequences. We can accommodate these differences in a rough fashion, generating an “evolutionary morph.” Users have already submitted hundreds of examples of protein motions to our server, producing a comprehensive set of statistics. So far the statistics show that the median submitted motion has a rotation of ~10º and a maximum Ca displacement of 17 Å. Almost all involve at least one large torsion angle change of >140º. The server is accessible at http://bioinfo.mbb.yale.edu/MolMovDB.
Introduction
Solved structures and related structural information on proteins is growing at an exponential rate. This is due chiefly to continuous technological progress in X-ray crystallography, NMR spectroscopy, and computer technology. As researchers solve structures at an ever increasing rate, there occurs an obvious need for processing techniques to relate such structures to one another, beyond classification or structural alignment. Protein motions, as an essential link between structure and function, are an obvious area of relationships between protein structures in the databases. Motion is intimately related to the way a structure fulfills a particular function. Protein motions are involved in a wide variety of basic functions, including regulation, transport of metabolites, formation of large assemblies, and cellular locomotion. Examples can be found throughout nature, from local conformational changes involved in the binding of ligands [1] that occur in enzymatic reactions to the complex rearrangement of covalent bonds [2].
Obviously, one of the best ways to represent and communicate protein motions is through “movies,” especially when they are made available over the web. There have been a number of previous efforts in this area. Vonrhein et al. [3, 4] made a custom movie of calmodulin and placed it on the Web. Similar work has been done by Sawaya et al., who created movies of crystal structures of polymerase beta [5]. Ray-traced 3-D molecular dynamics simulation of acetylcholinesterase from multagenesis data have also been made available [6-8]. More recently, movies from molecular dynamics simulations of protein folding (plp group) [9, 10] have been available on the Internet. Xu et al used the techniques of normal mode analysis to produce a morph movie of GroEL from structural data. [11-14]
In this paper we present a perspective on how protein motions can be put into standardized, consistent terms. We develop a simple model for protein motions involving rigid-body motion of parts, apply our model to actual cases, and measure how well it fits. Our approach is embodied in an integrated Web server that provides tools to compare solved conformations of proteins involved in motion, generates statistics to characterize and classify them into a database, and automatically makes a morph movie to represent them. In addition, the server presents a database linking protein motions with custom movies of motions available at other sites, along with our own morphs generated automatically by the server upon request by members of the Internet community. Our server and database have been used by Internet users to analyze a number of recent structures including human interleukin 5 [15], bc1 complex [16, 17], glycerol kinase [18, 19], and lactoferrin [20, 21]. It has also been used as a source of raw data in visualization tools [22] and in relation to other biological databases [23]. The Web server is accessible at: http://bioinfo.mbb.yale.edu/MolMovDB/morph. It is integrated with the Database of Macromolecular Motions [24, 25] and is also connected with a variety of tools for aligning protein folds and studying their occurrence in genomes [26-29].
Information Flow
The best way to understand our approach is in terms of the “information flow” diagrammed in Figure 1. One starts by submitting two or more conformations[1] of a given protein to the server. Then, through a variety of transformations, the server classifies the motion in the database and produces an appealing movie.
Data sources
Solved conformations analysis as performed by the server’s tools requires two kinds of information: (1) three-dimensional atomic coordinates of protein conformations as solved structure files (such as those at the PDB) and, more importantly, (2) information relating two or more of these solved structures, thus selecting them for analysis. (Such information, for instance, could come from the SCOP Database [30, 31], from automated searching of databases for proteins related by structure or sequence, or from a simple user input form on the Web.) A selection scheme is important because the number of ordered pairs of PDB structures is rather large (more than 100002). Figure 2 diagrams the server in the larger context of data sources.
Alignment
Once a string of structures has been given to the server, the first step is to establish equivalence (an alignment) between residues in the various proteins. This is necessary because the protein structures compared, while sharing some evolutionary or structural similarity, will, in general, not share the same amino acid sequence. Consequently, an alignment is necessary.
Because the server may be asked to simultaneously compare more than two sequences, an algorithm capable of simultaneously aligning multiple sequences (or structures) and potentially building an evolutionary tree must be used. For this purpose, we have chosen the AMPS algorithm [32-34]. In cases in which sequence alignment is inappropriate, such as for highly diverged homologs, we use the technique of structure alignment [28, 29]. The latter method relies primarily on the use of 3D coordinates (i.e., solved PDB structures of proteins) to produce a sequence alignment otherwise analogous to an alignment produced purely from sequence information. As a result, the structural method is able to generate meaningful sequence alignments from both highly related proteins and completely unrelated proteins sharing similar structural features due to convergent evolution. Sequence alignment is used unless sequence similarity is below a user-defined cutoff, at which point structure alignment is used. The choice of approach (sequence or structural alignment) may also be forced by the user upon morph submission.
Superposition
One of the major aims of the server is to collect standardized statistics on the proteins involved in motions. Standardized statistics, such as maximum rotation or maximum Ca displacement, are computed with respect to a specific superposition and reference frame, and so the superposition algorithm is central to any conformational analysis tool.
The output of the alignment procedure establishes residue equivalencies that are used in an intelligent superposition of the structures onto one another. Traditional “all-atom” RMS superposition minimizes the RMS difference between Ca atoms in the open and closed conformations. In a simple hinge motion, e.g., Calmodulin, such an alignment fits the closed conformation symmetrically inside the open conformation (Figure 3). Amongst other things, the maximum Ca displacement computed from such a superposition is considerably underestimated from the common sense alignment, and the morph movie gives the impression of motion far more complicated than a simple opening of a hinge. Instead, we perform the superposition with a modified “sieve-fit” procedure [35, 36]. The procedure is iterative. On each iteration the remaining Ca atoms are superimposed by a standard RMS fit, and then the pair of corresponding Ca atoms furthest apart are eliminated. This is repeated until approximately half of the atoms in the protein have been eliminated. Previously described uses of the “sieve-fit” procedure [36, 37] used some sort of cut-off value to determine when to stop the procedure, typically RMS deviation. No single RMS deviation cut-off value has consistently worked well. However, we have found that by stopping the procedure after approximately half the atoms have been discarded, one of the “domains” thus selected generally corresponds approximately to a superset or a subset of a real domain in the structure, and is thus well suited for performing the subsequent axes transformations.
Orientation & Hinge Location
To locate the screw-axis, a “fit-refit” procedure, as described by Lesk & Chothia [38] is used. Following superposition of the starting and ending conformations, we only consider the set of eliminated atoms. We perform a RMS-fit of that set between the starting and ending conformations; the server performs the new superposition (arbitrarily) on the ending conformation. A comparison of the new position of the ending conformation following this latest fit with its position following the “sieve-fit” procedure yields a geometric transformation whose screw axis is (approximately) the axis of the hinge motion, i.e., the location of the hinge, as has been published elsewhere [39]. Straightforward calculations allow characterization of the angle of rotation around the hinge axis.
If a significant hinge motion is present, the software uses these transformations to align the Z-axis of the coordinate frame parallel to the hinge axis so that, when the motion is rendered, viewers will look down the screw-axis of the hinge motion. The longest moment of the protein (long axis) is rotated (optionally) so that it is parallel to the Y-axis. Finally, the coordinate frame is translated so that the centroid of the initial conformation is in the center of the field of view.
The software also attempts to locate putative hinge regions using a simple and relatively fast algorithm. The algorithm looks for a persistent transition between the two domains identified by the program. The algorithm constructs a search window, initially with 24 residues. It examines each position along the peptide backbone in this window. If there is a persistent transitions (i.e., one-half of the algorithm’s search window belonging to one “domain” and the other half to the other), a hinge is detected. If the program fails to find any hinges along the backbone chain, the window size is reduced by two, and the procedure is repeated until the window size has been shrunk down to twelve residues, at which point the program reports failure. Empirically, this crude but computationally inexpensive algorithm successfully finds many hinge regions, such as the hinge region for calmodulin, which agree well with published residue selections. In other cases, the algorithm comes close, identifying a residue selection that borders on a hinge. Hinges may be displayed graphically via a “hinge movie” identifying the putative hinge region or regions in red.
In related work, Wriggers et al presented techniques to identify protein domains and common hinges using an adaptive least-squares fitting technique [40]; the user is presented with a number of options (spatial connectivity maintenance, significant structural difference filters) to ensure optimal hinge finding. For the remote user’s convenience, our own hinge finder is at present fully automatic and presents no options to the user. It may be advantageous for us to provide such options in the future so that the user can override and improve on the putative hinge initially selected by our algorithm, although this would partially defeat our efforts at standardization. Maiorov et al [41] have developed a system which detects hinges by large-scale sampling of torsion angle space; this technique, while presumably more accurate, is also much more computationally expensive then our current technique. It may be useful for us to give the user the option of using alternate hinge finding engines in the future.
To illustrate the putative hinge finder, a frame from one such “hinge movie” is given in Figure 4, with the putative hinge identified in black. Superposition, orientation, and hinge-finding are relatively fast steps, requiring a fraction of a second of computer time on our server.
Homogenization
We have modified the X-PLOR package [42] to homogenize the stored coordinates. This problem is non-trivial [43, 44]. The initial, solved intermediate, and final conformations are parsed by X-PLOR and examined for missing non-hydrogen coordinates. These are filled in using energy minimization with the known coordinates of the molecule fixed at their solved positions. If these missing coordinates are available in another solved conformation, the coordinates from the superimposed and rotated conformation are used as an initial guess as to their likely positions. As written, filling-in of missing non-hydrogen coordinates is necessary for the energy minimization subsystems to work robustly with a large number of PDB files. It also ensures homogenized output of PDB files, which is required by the visual rendering subsystem.
Interpolation
The next step is in the dominion of what we refer to as the “interpolation engine.” Once the structures have been homogenized in terms of solved atomic coordinates, interpolation may proceed. Under command of the script, the custom X-PLOR interpolation function is repeatedly called, each time evenly reducing the distance between the current structure and the final structure. When more than two solved conformations are present, the distance between the current structure and a solved intermediate conformation is evenly reduced instead. Each step is followed by a round of energy minimization to correct molecular stereochemistry and enforce rules of chemical reality on the structure. To ensure that the final frames are as accurate as possible, the solved endpoint structures are used for these. When solved intermediates are present, these are inserted as frames at regular intervals. The entire process takes only a few minutes to produce ten frames running on a 500 MHz Intel Pentium III workstation running Linux.
There are many possible interpolation strategies, and a number of tradeoffs between accuracy, various computational resources, time, and other are involved in the choice. For this reason, in addition to our original adiabatic mapping engine, we offer the user two engines based on LSQMAN [45, 46] (one Cartesian-based and another based on internal phi, psi coordinates), which are faster but appear to be less realistic. Users wishing to add their own, non-trivial interpolation engines may contact the authors to make arrangements to do so. For example, a user wishing to analyze a very large number of trajectories (10000 or more from, e.g., samplings from molecular dynamics simulations) or higher might wish to supply a simplified interpolation engine and make other arrangements to allow the computations to be completed in a reasonable amount of time.
We chose our original technique, known in the literature as adiabatic mapping [47] for reasons of computational efficiency. It is a technique that produces chemically reasonable morphs with a modest amount of computational power and thus is most suitable for a Web-based server. This remains the default interpolation engine for the server. Using this engine, the server can produce a realistic interpolation of a protein and have the results rendered and returned to the user in less than three minutes on a fast Pentium III machine. Using adiabatic mapping, we have also produced our own morph of the motion in GroEL which, although probably less accurate than the considerably more expensive technique of normal mode analysis [11-14], is probably good enough for most researchers seeking only a visual representation. Nevertheless, we believe that, for many proteins, most real motions will occur along the interpolated trajectories, and the morph server may be used to predict intermediate conformations should they exist. How close our predicted pathways come to reality is perhaps best answered through the emerging technique of time-resolved x-ray crystallography [48, 49]. Thus, an adiabatic mapping engine is much more suited to our goal of automatically interpolating a large percentage of the motions in our database.
Visual Rendering
With the intermediate conformations morphed, the molecule is now visually rendered. We have written a Perl script that produces VRML 2.0 (Moving 3-D Worlds) code [50, 51] on-the-fly from the intermediate PDB files. The VRML 2.0 output is suitable for interactively viewing the moving 3D macromolecule in a VRML 2.0 Internet browser, such as SGI CosmoPlayer 2.0. The advantage of the 3D display format is that the remote Internet user may easily choose a preferred orientation and vantage point.
The molecule is also rendered as a 2-D movie in the MultiGif, Quicktime, and MPEG formats, as well as an Adobe Portable Document Format (PDF) [52] page showing the individual frames. Remote adjustment of vantage point and orientation is not possible in the simpler 2D video format, so the molecule is rendered with the screw axis perpendicular to the plane of the display device, as was computed during the orientation process. The molecule is rendered in three display types [53, 54]: ribbons (with secondary structure indicated), lines (as a simple alpha chain), and ball and stick (showing all individual non-hydrogen atoms). The first two formats are also rendered into a small moving MultiGif icon to afford the database user with a quickly downloaded preview of the larger movies available.
Statistics
In the process, key standardized statistics are recorded. These include maximum Ca displacement, rotation angle in degrees around putative hinge regions, sequences of the putative hinge regions, average torsion angle change in the hinge region versus the overall average, distance of the putative hinge region from the screw axis, distance of the screw axis from the centroid, a structural comparison score between the two domains, and a number of additional, useful statistics, such as the differences in torsion angles at every aligned position and the pseudo CHARMM/X-PLOR [42, 55] energy at each point in the morph.
These statistics are detailed enough to perform an automatic preliminary classification of the motion and determine the location of the hinge relative to the transformed axes. (For example, a large rotation angle indicates a probable hinge motion.) A detailed description of our statistical results is given in Table 1 for five motions. Ranges and averages of some of these statistics after several hundred alignments are given in Table 2 along with similar but sparse statistics culled manually from the scientific literature for comparison.
For example, over approximately 175 motions submitted for analysis, the median motion has a maximum rotation of 9.5º over a range of 0 through 150º as computed by our algorithm, whereas the twelve motions culled from the scientific literature had an average rotation of 24º over a range of 5 through 148º. Similarly, our algorithms found a median maximum Ca displacement of 17 Å ranging from 0 to 81Å for the submitted motions, whereas eleven motions reported in the scientific literature average 12Å over a range of 1.5 through 60Å. Although most of the structures are very similar in sequence, the server has been able to accommodate sequence identity down to 8% for some motions (see Table 3). Most motions have at least one large torsion angle change (see Table 4).
The sparseness of manually culled data in Table 2 is due to the lack of a standardized nomenclature for these statistics in the scientific literature. It is worth noting that a different set of proteins had to be used for each of the manually culled tallies in Table 2. Because these statistics predate the server, they serve as a manual “gold standard” against which the results of the server may be compared. Table 1 presents a statistical description of motions in the database, a main scientific benefit of the server.
Integration with Database
Privacy is a concern with some submissions, so users are afforded the option to either keep their submissions secret until the results have been published or to cause the submission to appear immediately in an index. For each successfully completed morph, the server produces a Web page allowing easy download of the coordinates (as an archive of PDB files or in NMR format) or movies (in a number of video formats), in addition to displaying the molecule in the moving VRML format. The page includes the standardized statistics discussed above generated for the conformations used in the morph. This page may be accessed through a URL containing a special code that is emailed back to the submitting user when the morph is complete; for users seeking to keep their morphs private (for publication reasons), this URL serves as the user’s password, allowing access to the morph page in the server. For public morphs, these pages are also accessible through an index, http://bioinfo.mbb.yale.edu/MolMovDB/movies.
The ultimate flow of information is circular. For each motion we either link it via a motion id to an existing entry in the Macromolecular Motions Database or we generate a new entry in the database. The results of analyzing particular ordered sets of structures (‘strings’ of structures) are entered under an appropriate identifier into the Database of Macromolecular Motions for further reference, and, in many cases, suggest further structures to study and analyze. Each comparison is assigned a unique ID entered into the “comparison table” in the database that references the IDs of the PDB structures involved. These comparisons are, in turn, referenced by entries in the motions database (these references may be generated by comparing the IDs of the PDB structures referenced in each comparison table entry with the PDB structures referenced in each motion table entry.). Because many motions in the database are associated with more than two structures, more than one comparison is often possible and some database entries do reference multiple comparisons.
New movies, which lack a motion entry in the Database of Macromolecular Motions, have an entry automatically created with minimal or no annotation. This is indicated in the entry by setting the annotation level to zero. (Annotation levels range from 0 to 10. A level of “0” indicates the entry was automatically created with no human intervention. “10” indicates significant human intervention, typically in the form of a large amount of descriptive text present in the entry.) The user can annotate the new entry using an easy-to-use edit form displayed in his or her Web browser. Existing entries are also editable by the community through the same Web form with prior authorization from the database’s maintainers. All changes are subsequently reviewed by the maintainers to assure quality control. In this way, the Database of Macromolecular Motions is used to classify and organize morphs submitted to the Morph Server.
Examples
To illustrate the technique of adiabatic mapping as implemented by the server, Figures 4 depicts the frames in five automatically generated morphs produced by the server’s adiabatic mapping interpolation engine.
ADH. First is a “trivial” morph, Alcohol Dehydrogenase [56, 57]. This morph is considered “trivial” because a true motion is involved, and the endpoint conformations are sufficiently close together that a pathway between the two—not involving chain breaks or clearly distorted geometry—is easy to construct in the mind’s eye. Therefore, one would intuitively expect software that claims to perform morphing to handle this case with similar ease. This is indeed the case, as can be seen in the figure, which depicts the frames generated by the morph server for the morph of Alcohol Dehydrogenase. The protein has very little movement; the figure shows the frames in the motion generated by our server with an arrow to indicate the region of movement. When the actual animation is played back, the arrow is not necessary, as the eye has evolved to be especially sensitive to motion and easily picks out the movement in the movie.
Recoverin. Recoverin [58-60] is an example of a “typical” morph. The morph is considered “typical” because a true motion is involved, as can be seen in the figure, the motion involves most of the molecule and is therefore qualitatively more extensive than that of a “trivial” motion such as Alcohol Dehydrogenase. The motion is sufficiently complicated that a simple linear interpolation would produce at least some obvious distortion and physical impossibilities. Nevertheless, the adiabatic mapping interpolation engine produces a realistic morph without chain breaks or clearly distorted geometry.
Pol-beta. A morph of DNA Polymerase Beta [5, 61], considered “typical” for much the same reasons as recoverin.
GroEL. The user should be aware of a number of problems that can be encountered in the adiabatic mapping method. Problems arise for large deformations if the energy minimization methods cannot effectively remove the accumulated stresses [62]. These problems are endemic to all adiabatic mapping systems, including our Web server. This problem is illustrated in Figure 5d, which shows a morph of one subunit in GroEL [11-14], a “medium difficulty” morph because of the considerable atomic displacements between the starting and ending conformations. However, this GroEL motion still represents a true protein motion, and the server still produces a fairly realistic interpolation. One means of improving this morph would be to have the user select additional interpolation frames (and, hence, additional energy minimizations). (This is in a sense a “feature” that highlights which motions are sterically more difficult to achieve.)
DT. Our model will, of course, break when fed an “impossible” morph, as shown in Figure 5e. The endpoint conformations are that of diphtheria toxin (DT), not a true motion but rather an example of domain swapping [63, 64] in which the domains in DT have been solved while bound in two different configurations. For one conformation to “morph” into another, the easiest physically realistic route would be for one domain to unfold and refold. Indeed, the morph generated by the server does suggest a process of this sort.
While the morph server is unable to generate a physically realistic movie of this “motion,” it does suggest that the morph server may be used as a quick visual tool in evaluating the validity of a proposed motion. Comprehensive statistics for all five morphs may be found in Table 1.
Discussion
Statistics
In a majority of cases the structures of a given macromolecule involved in motions have been solved in two or more conformations, so that endpoints for the motion are available. This, in turn, means that automatic conformation comparison tools are possible, which, when applied en masse to the motions database, allow the generation of a consistent, standardized set of statistics characterizing the motions in the database. In the process of analyzing the structures, pathway interpolation is possible as well.
What constitutes an optimal morph?
Since the goal of the server was to output only a single interpolated pathway “morph”, it is necessary to define more precisely what is desired. Define the “optimal morph” as the most likely (or most frequently taken) pathway between two conformations. In the large dimensional space of macromolecular atomic coordinate space, an infinite number of paths between conformations exist, so that establishing that a given local ensemble of pathways is the most statistically probable is, in general, computationally intractable. A more realistic approach would be simply to find a morph that is a reasonably good reaction coordinate that does not produce any large chemical distortions. This reduced the computational complexity of the problem, yet ensured that the resulting morph would be insightful, yet likely be very similar to the “optimal” morph.
Unlike the adiabatic interpolation engine used in the server, a number of interpolation engines on proteins have taken approaches that do not meet these criteria. With the exception of the simplest motions, simple linear interpolations of atomic coordinates without consideration of physical reality yields intermediates with clearly distorted geometry. In some cases, atoms may be significantly closer than their van der Waals radii would permit, or further apart than a chemical bond would reasonably be expected to allow. A more sophisticated approach to morph movies not currently taken by the server due to its stringent computational requirements, but one which might be added in the future, involves the use of normal mode analysis, such as was done on GroEL by Xu et al [11-14].
Conclusions
We have developed an integrated set of protein conformation comparison tools on the Web for use in conjunction with the Macromolecular Motions Database or as a stand-alone, publicly accessible server. When solved endpoint structures are available, the server can produce a useful comparison of the structures involved in protein motions. The server also implements a database of protein motions accessible on the Web or generated by Internet users through our server; this database is integrated into the Molecular Motions Database.
The server collects a number of statistics on the motion, including maximum Ca displacement and maximum rotation around the putative hinge, which are useful both in analyzing and classifying individual proteins and in generating a statistical picture of motions in the motions database as a whole. The software also homogenizes the incoming structures, attempting to solve for missing atoms using a molecular dynamics algorithm. The server then uses an adiabatic mapping technique to generate a visually rendered interpolated pathway, or ‘morph’, of the motion or evolution of the protein. The homogenized endpoint coordinates and the generated intermediate coordinates are made available for download.
The software presents the visual representation, statistics, orientation, alignment, and interpolated coordinates to the user. At user option, these results may become public immediately or remain private until paper publication. Through an easy-to-use Web form, the user is afforded an opportunity to create a descriptive entry in the Database of Macromolecular Motions for the protein structures involved, referencing the morph results, as well. We have found the server useful in the analysis of protein motions and anticipate that use of the server will help standardize statistics and nomenclature for protein motions subsequently presented in the scientific literature.
Acknowledgements
The authors gratefully acknowledge the financial support of the Keck Foundation and the National Science Foundation (Grant DBI-9723182). Numerous people have also either contributed entries or information to the database and morph server or have given us feedback on what the user community wants. The authors also wish to thank Informix Software, Inc. for providing a grant of its database software.
References
1. Debrunner, P.G. and H. Frauenfelder, Dynamics of proteins. Annual Rev. of Phys. Chem., 1982. 33: p. 283.
2. Lipscomb, W.N., Acceleration of reactions by enzymes. Accounts Chem. Res., 1982. 15: p. 232.
3. Vonrhein, C., G.J. Schlauderer, and G.E. Schulz, Movie of the structural changes during a catalytic cycle of nucleoside monophosphate kinases. Structure, 1995. 3: p. 483-490.
4. Vonrhein, C., et al., The structure of a trimeric archaeal adenylate kinase. J Mol Biol, 1998. 282(1): p. 167-79.
5. Sawaya, M.R., et al., Crystal structures of human DNA polymerase beta complexed with gapped and nicked DNA: evidence for an induced fit mechanism. Biochemistry, 1997. 36(37): p. 11205-15.
6. Gilson, M.K., et al., Open "Back Door" in a Molecular Dynamics Simulation of Acetylcholinesterase. Science, 1994. 263: p. 1276-1278.
7. Faerman, C., et al., Site-directed mutants designed to test back-door hypotheses of acetylcholinesterase function. FEBS Lett, 1996. 386(1): p. 65-71.
8. Ripoll, D.R., et al., An electrostatic mechanism for substrate guidance down the aromatic gorge of acetylcholinesterase. Proc Natl Acad Sci U S A, 1993. 90(11): p. 5128-32.
9. Pande, V.S. and D.S. Rokhsar, Molecular dynamics simulations of unfolding and refolding of a beta- hairpin fragment of protein G [In Process Citation]. Proc Natl Acad Sci U S A, 1999. 96(16): p. 9062-7.
10. Pande, V.S. and D.S. Rokhsar, Folding pathway of a lattice model for proteins. Proc Natl Acad Sci U S A, 1999. 96(4): p. 1273-8.
11. Xu, Z., A.L. Horwich, and P.B. Sigler, The crystal structure of the asymmetric GroEL-GroES-(ADP)7 chaperonin complex. Nature, 1997. 388(6644): p. 741-750.
12. Rye, H., et al., Distinct actions of cis and trans ATP within the double ring of the chaperonin GroEL. Nature, 1997. 388(6644): p. 792-798.
13. Xu, Z. and P.B. Sigler, GroEL/GroES: structure and function of a two-stroke folding machine. J Struct Biol, 1998. 124(2-3): p. 129-41.
14. Sigler, P.B., et al., Structure and function in GroEL-mediated protein folding. Annu Rev Biochem, 1998. 67: p. 581-608.
15. Verschelde, J.L., et al., Analysis of three human interleukin 5 structures suggests a possible receptor binding mechanism. FEBS Lett, 1998. 424(3): p. 121-6.
16. Crofts, A.R., et al., Pathways for proton release during ubihydroquinone oxidation by the bc(1) complex. Proc Natl Acad Sci U S A, 1999. 96(18): p. 10021-10026.
17. Crofts, A.R. and E.A. Berry, Structure and function of the cytochrome bc1 complex of mitochondria and photosynthetic bacteria. Curr Opin Struct Biol, 1998. 8(4): p. 501-9.
18. Bystrom, C.E., et al., Crystal structures of Escherichia coli glycerol kinase variant S58-->W in complex with nonhydrolyzable ATP analogues reveal a putative active conformation of the enzyme as a result of domain motion. Biochemistry, 1999. 38(12): p. 3508-18.
19. Feese, M.D., et al., Glycerol kinase from Escherichia coli and an Ala65-->Thr mutant: the crystal structures reveal conformational changes with implications for allosteric regulation. Structure, 1998. 6(11): p. 1407-18.
20. Thompson, A.B., et al., Aerosolized beclomethasone in chronic bronchitis. Improved pulmonary function and diminished airway inflammation. Am Rev Respir Dis, 1992. 146(2): p. 389-95.
21. Sykes, J.A., et al., Plasma lactoferrin levels in pregnancy and cystic fibrosis. Clin Chim Acta, 1982. 122(3): p. 385-93.
22. Martz, E., Protein Explorer (software package), . 1999, URL: http://www.umass.edu/microbio/chime/explorer/index.htm.
23. Schnecke, V., et al., Screening a peptidyl database for potential ligands to proteins with side-chain flexibility. Proteins, 1998. 33(1): p. 74-87.
24. Gerstein, M. and W. Krebs, A Database of Macromolecular Movements. Nucl. Acids Res, 1998. 26(18): p. 4280.
25. Gerstein, M.B., et al., Studying Macromolecular Motions in a Database Framework: From Structure to Sequence, in Rigidity theory and applications, M.F. Thorpe and P.M. Duxbury, Editors. 1999, Kluwer Academic/Plenum press. p. 401-442.
26. Gerstein, M., A Structural Census of Genomes: Comparing Bacterial, Eukaryotic, and Archaeal Genomes in terms of Protein Structure. J. Mol. Biol., 1997: p. (in press).
27. Gerstein, M. and C. Wilson, Assessing Annotation Transfer for Genomics: Quantifying the relations between protein sequence, structure, and function through traditional and probabilistic scores. J Mol Biol, 2000. (in press).
28. Gerstein, M. and M. Levitt, Comprehensive Assessment of Automatic Structural Alignment against a Manual Standard, the Scop Classification of Proteins. Protein Science, 1998. 7: p. 445-456.
29. Levitt, M. and M. Gerstein, A Unified Statistical Framework for Sequence Comparison and Structure Comparison. Proceedings of the National Academy of Sciences USA, 1998. 95: p. 5913-5920.
30. Murzin, A., et al., SCOP: A Structural Classification of Proteins for the Investigation of Sequences and Structures. J. Mol. Biol., 1995. 247: p. 536-540.
31. Hubbard, T.J.P., et al., SCOP: a structural classification of proteins database. Nucleic Acids Res, 1997. 25(1): p. 236-9.
32. Barton, G.J. and M.J.E. Sternberg, A strategy for the rapid multiple alignment of protein sequences: Confidence levels from tertiary structure comparisons. J Mol Biol, 1987. 198(2): p. 327-338.
33. Barton, G.J. and M.J.E. Sternberg, Flexible protein sequence patterns: A sensitive method to detect weak structural similarities. J Mol Biol, 1990. 212(2): p. 389-402.
34. Barton, G.J., Methods in Enzymology, 1990. 183: p. 403-428.
35. Lesk, A.M., Protein Architecture: A Practical Approach. 1991, Oxford: IRL Press.
36. Gerstein, M. and C.H. Chothia, Analysis of Protein Loop Closure: Two Types of Hinges Produce One Motion in Lactate Dehydrogenase. J. Mol. Biol., 1991. 220: p. 133-149.
37. Gerstein, M. and R. Altman, Average core structures and variability measures for protein families: Application to the immunoglobulins. J. Mol. Biol., 1995. 251: p. 161-175.
38. Lesk, A.M. and C. Chothia, Mechanisms of Domain Closure in Proteins. J. Mol. Biol., 1984. 174: p. 175-91.
39. Gerstein, M., A. Lesk, and C. Chothia, Structural Mechanisms for Protein Motions, in Protein Motions, S. Subbiah, Editor. 1995, R G Landes: Austin, TX. p. (in press).
40. Wriggers, W. and K. Schulten, Protein domain movements: detection of rigid domains and visualization of hinges in comparisons of atomic coordinates. Proteins, 1997. 29(1): p. 1-14.
41. Maiorov, V. and R. Abagyan, A new method for modeling large-scale rearrangements of protein domains. Proteins, 1997. 27(3): p. 410-24.
42. Brünger, A.T., X-PLOR 3.1, A System for X-ray Crystallography and NMR. 1993, New Haven: Yale University Press.
43. Hogue, C.W., H. Ohkawa, and S.H. Bryant, A dynamic look at structures: WWW-Entrez and the Molecular Modeling Database. Trends Biochem Sci, 1996. 21(6): p. 226-9.
44. Ohkawa, H., J. Ostell, and S. Bryant, MMDB: an ASN.1 specification for macromolecular structure. Ismb, 1995. 3: p. 259-67.
45. Kleywegt, G.J. and T.A. Jones, Where freedom is given, liberties are taken. Structure, 1995. 3(6): p. 535-40.
46. Kleywegt, G.J. and T.A. Jones, Phi/psi-chology: Ramachandran revisited. Structure, 1996. 4(12): p. 1395-400.
47. McCammon, J.A. and S.C. Harvey, Dynamics of Proteins and Nucleic Acids. 1987: Cambridge UP.
48. Moffat, K., Time-resolved macromolecular crystallography. Annu. Rev. Biophys. Biophys. Chem., 1989. 18: p. 309-32.
49. Genick, U.K., et al., Structure of a protein photocycle intermediate by millisecond time- resolved crystallography. Science, 1997. 275(5305): p. 1471-5.
50. Silicon-Graphics, VRML 2 Specification. 1996: p. http://webspace.sgi.com/moving-worlds/Design.html.
51. Pesce, M., VRML. 1995, Indianapolis, IN: New Riders.
52. Introduction to Acrobat Reader, in Description of Portable Document Format, Adobe Corporation: URL: http://www.adobe.com/supportservice/custsupport/SOLUTIONS/ac76.htm.
53. Kraulis, P.J., MOLSCRIPT - A program to produce both detailed and schematic plots of protein structures. J. Appl. Cryst., 1991. 24: p. 946-950.
54. Sayle, R., RasMol. 1994.
55. Brooks, B.R., et al., CHARMM: A Program for Macromolecular Energy, Minimization, and Dynamics Calculations. J. Comp. Chem., 1983. 4: p. 187-217.
56. Colonna-Cesari, F., et al., Interdomain motion in liver alcohol dehydrogenase: structural and energetic analysis of the hinge bending mode. J. Biol. Chem., 1986. 261: p. 15273-15280.
57. Eklund, H., et al., Structure of a triclinic ternary complex of horse liver alcohol dehydrogenase at 2.9 A resolution. J. Mol. Biol., 1981. 146: p. 561-587.
58. Ames, J.B., et al., Molecular mechanics of calcium-myristoyl switches. Nature, 1997. 389(6647): p. 198-202.
59. Tanaka, T., et al., Sequestration of the membrane-targeting myristoyl group of recoverin in the calcium-free state. Nature, 1995. 376(6539): p. 444-7.
60. Ames, J.B., et al., Nuclear magnetic resonance evidence for Ca(2+)-induced extrusion of the myristoyl group of recoverin. J Biol Chem, 1995. 270(52): p. 30909-13.
61. Sawaya, M.R., et al., Crystal structure of rat DNA polymerase beta: evidence for a common polymerase mechanism. Science, 1994. 264(5167): p. 1930-5.
62. Tung, C.S., S.C. Harvey, and J.A. McCammon, Large-amplitude bending motions in phenylalaine transfer RNA. Biopolymers, 1984. 23: p. 2173.
63. Bennett, M.J., M.P. Schlunegger, and D. Eisenberg, 3D domain swapping: a mechanism for oligomer assembly. Protein Sci, 1995. 4(12): p. 2455-68.
64. Bennett, M.J., S. Choe, and D. Eisenberg, Domain swapping: entangling alliances between proteins. Proc Natl Acad Sci U S A, 1994. 91(8): p. 3127-31.
Figures and Tables
Figure 1. Diagram of our
approach. The information flow from databases, through the server, and then
back again to databases is broken down into its component steps. Experimental
data in the PDB and other databases is converted into a motion entry in the
Database of Macromolecular Motions, from whence a morph movie is generated and
statistics are collected. These results are subsequently stored in the Database
of Macromolecular Motions. The interaction of the server with the peripheral
parts in the figure (“Database Information”, “Experimental Methods and
Simulations”, and “Users”) is largely under users’ control, although we are
developing automated tools to generate comparisons automatically from databases
such as SCOP. The results of a comparison are both returned to the user and
referenced in the Database of Macromolecular Motions, hence the arrow back to
“Database Information.” The Web report extract information both from server
results and from pre-existing information in the Database of Macromolecular
Motions, if any, hence the arrow from “Database Information” to “Web Report.”
|
|
|
|
|

Figures 2a (left), 2b (top right), and 2c (bottom right)
Figure 2a (left)
Here, the information flow may be visualized as a series of linked Web pages. Users submit new motions to the server via either the Server Submission Form or via a simplified interface through the Structural Alignment Server’s submission form. The query is processed by the server. If the morph operation is successful, the new morph is added to the Table of Morph Movies (which links off-site URLs as well). This table has links to both the morph’s report form (from which the morph may be viewed) and also the associated motion entry in the Database of Macromolecular Motions is the motion has one. An entry is also created in the motion’s entry in the Database of Macromolecular Motions, linking the motion’s report to the report for the morph movie.
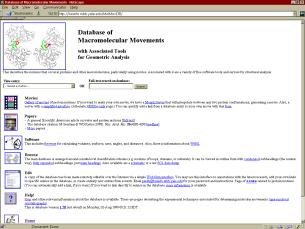
Figure 2b (top right)
This is a blow up of main page of database from Figure 2a. The entry page of the Database of Macromolecular Motions, http://bioinfo.mbb.yale.edu/MolMovDB is shown above. Users may jump from this to entries on specific motions, many of which link morph movies, or to a table of morphs (Figure 2c).
Figure 2c (bottom right)
This is a blow up of On-line Table of Morphs from Figure 2a. Screen shot of the on-line table of morphs web page at http://bioinfo.mbb.yale.edu/MolMovDB/morphs. In addition to linking to the Web report page for the morph, each entry links to the corresponding database motion entry (if applicable) and provides information on the PDB Ids used the generate the morph movie, along with the information on the submitting user. This table also references off-site morph URLs, and thus functions as a comprehensive database of protein morphs available on the Internet.
Figure 3
Superposition of a Calmodulin-like protein undergoing a hinge motion.
Structures 1 and 2 indicate the closed and open conformations, respectively. Compare “Global Fit”, the superposition produced by a traditional least-squares fit of the structures, to “Core 1” and “Core 2”, the two possible superpositions produced by sieve-fitting. The final panel depicts how a morph movie might appear using the “Core 2” superposition.